


CoStar is a mobile app that simplifies property...
About the project
MyBike is designed to capture the joy and freedom of cycling through a personalized, rider-first experience.
Blending intuitive navigation, health integration, and real-time support, it transforms every ride into a smooth, empowering journey—bringing the simple pleasure of biking into the digital age.
Client
MyBike
Location
New York, USA
Industries
Date
2024
Travel Management Software | UX & UI Design
Logo Design
Visual System for Brand Recall
The project features a logo built around simplicity and motion. The abstract form suggests movement and cycling, using minimal shapes to create a strong, scalable symbol. This supports UI clarity and brand recognition across the app’s touchpoints.
The icon works well in both light and dark interfaces, contributing to consistent UX across screens. Its design aligns with the mobile app’s focus on health tracking, navigation, and ride optimization. In this example, the logo strengthens user engagement and improves recall, helping reduce churn and support long-term retention.
Travel Software | UX & UI Design
Research
Project Timeline Overview
This case study outlines the process behind the MyBike Mobile App project. It includes core phases in research, UX, and UI design focused on improving in-ride support, health alert visibility, and medication guidance. The project was delivered in 11 sprints, with each phase targeting user engagement, retention, and reduced error rate.
Travel Software Development Company | UX & UI Design
User Research
User Needs and Health Patterns
The project focused on identifying key health-related challenges during ride tracking and medication support. The research helped inform UX decisions around alerts, instruction flows, and interface feedback.
It guided decisions to reduce user error, improve session outcomes, and increase user satisfaction. Updated flows and support features were aimed at lowering churn and improving conversion from onboarding through regular usage.
In-App Support and Usage Insights
75% - More in-app support
Enhanced guidance and real-time assistance were prioritized to improve user confidence and reduce friction.
>50% - Missed medication instructions
Clearer presentation and reminders for medication instructions were introduced to minimize errors and ensure compliance.
>25% - Experienced side effects
A structured health alert system and proactive guidance were developed to address side effects and enhance rider safety.
SaaS Development | UX & UI Design AI In Travel Industry | UX & UI Design
User Profile
User behavior and analysis
To optimize conversion and engagement, we analyzed the behavior of active users within the project. One profile includes an urban cyclist who regularly uses the app to track routes, manage bike settings, and monitor ride performance.
This user values seamless UI flow and responsive MyBike Mobile App ui / ux design. Their feedback highlights intuitive navigation and efficient access to core features. They consistently interact with customizable settings and location tracking tools, increasing overall app usage frequency.
Key user actions
01
Navigates the app easily without onboarding friction.
02
Tracks bike performance and location metrics.
03
Adjusts preferences to personalize ride experience.
Product Design Service | UX & UI Design
Testing
Design shaped by feedback
We focused on identifying usability gaps, optimizing navigation, and improving interaction performance. Through user observations and feedback analysis, we collected actionable data to guide interface adjustments and feature clarity.
Key Findings
60% - Observations
User interaction sessions revealed key behavior patterns. Most users navigated the app without support, but struggled with feature discovery in some sections. These findings shaped UI layout decisions and micro-interactions.
30% - Negative Quotes
Collected feedback pointed to minor frustrations with customization steps and unclear onboarding flows. These insights contributed to revisions in button hierarchy and visual structure.
10% - Errors
Technical or interaction-related errors were limited. All identified issues were corrected before release, reducing friction and lowering the expected churn rate.
Artificial Intelligence Travel Industry | UX & UI Design AI In The Travel Industry | UX & UI Design
Design Problems and Fixes
50% - Real-time Data Inaccuracies
The majority of users experienced inconsistencies with GPS data and bike location tracking. This impacted trust and usability. The development team focused on improving API handling and backend synchronization to reduce latency and boost data accuracy.
30% - Complicated Safety Feature Integration
Users found the process of setting up security zones unintuitive. This insight led to simplified radius controls, contextual UI prompts, and visual cues, improving feature accessibility and task completion.
20% - Complex User Interface Navigation
Early prototypes revealed friction in navigating the main dashboard and feature areas. Based on feedback, the navigation model was redesigned using a bottom tab bar and grouped actions to improve flow and reduce bounce rates.
Solution
Iterative testing and design refinement improved the app’s functionality and ease of use. These changes contributed to higher user satisfaction, reduced CSR, and improved retention metrics.
This MyBike Mobile App – UI UX Design project reflects a focused response to real user needs through clear UI decisions and streamlined interaction logic.
Artificial Intelligence In Travel And Hospitality Industry | UX & UI Design SaaS Development Company
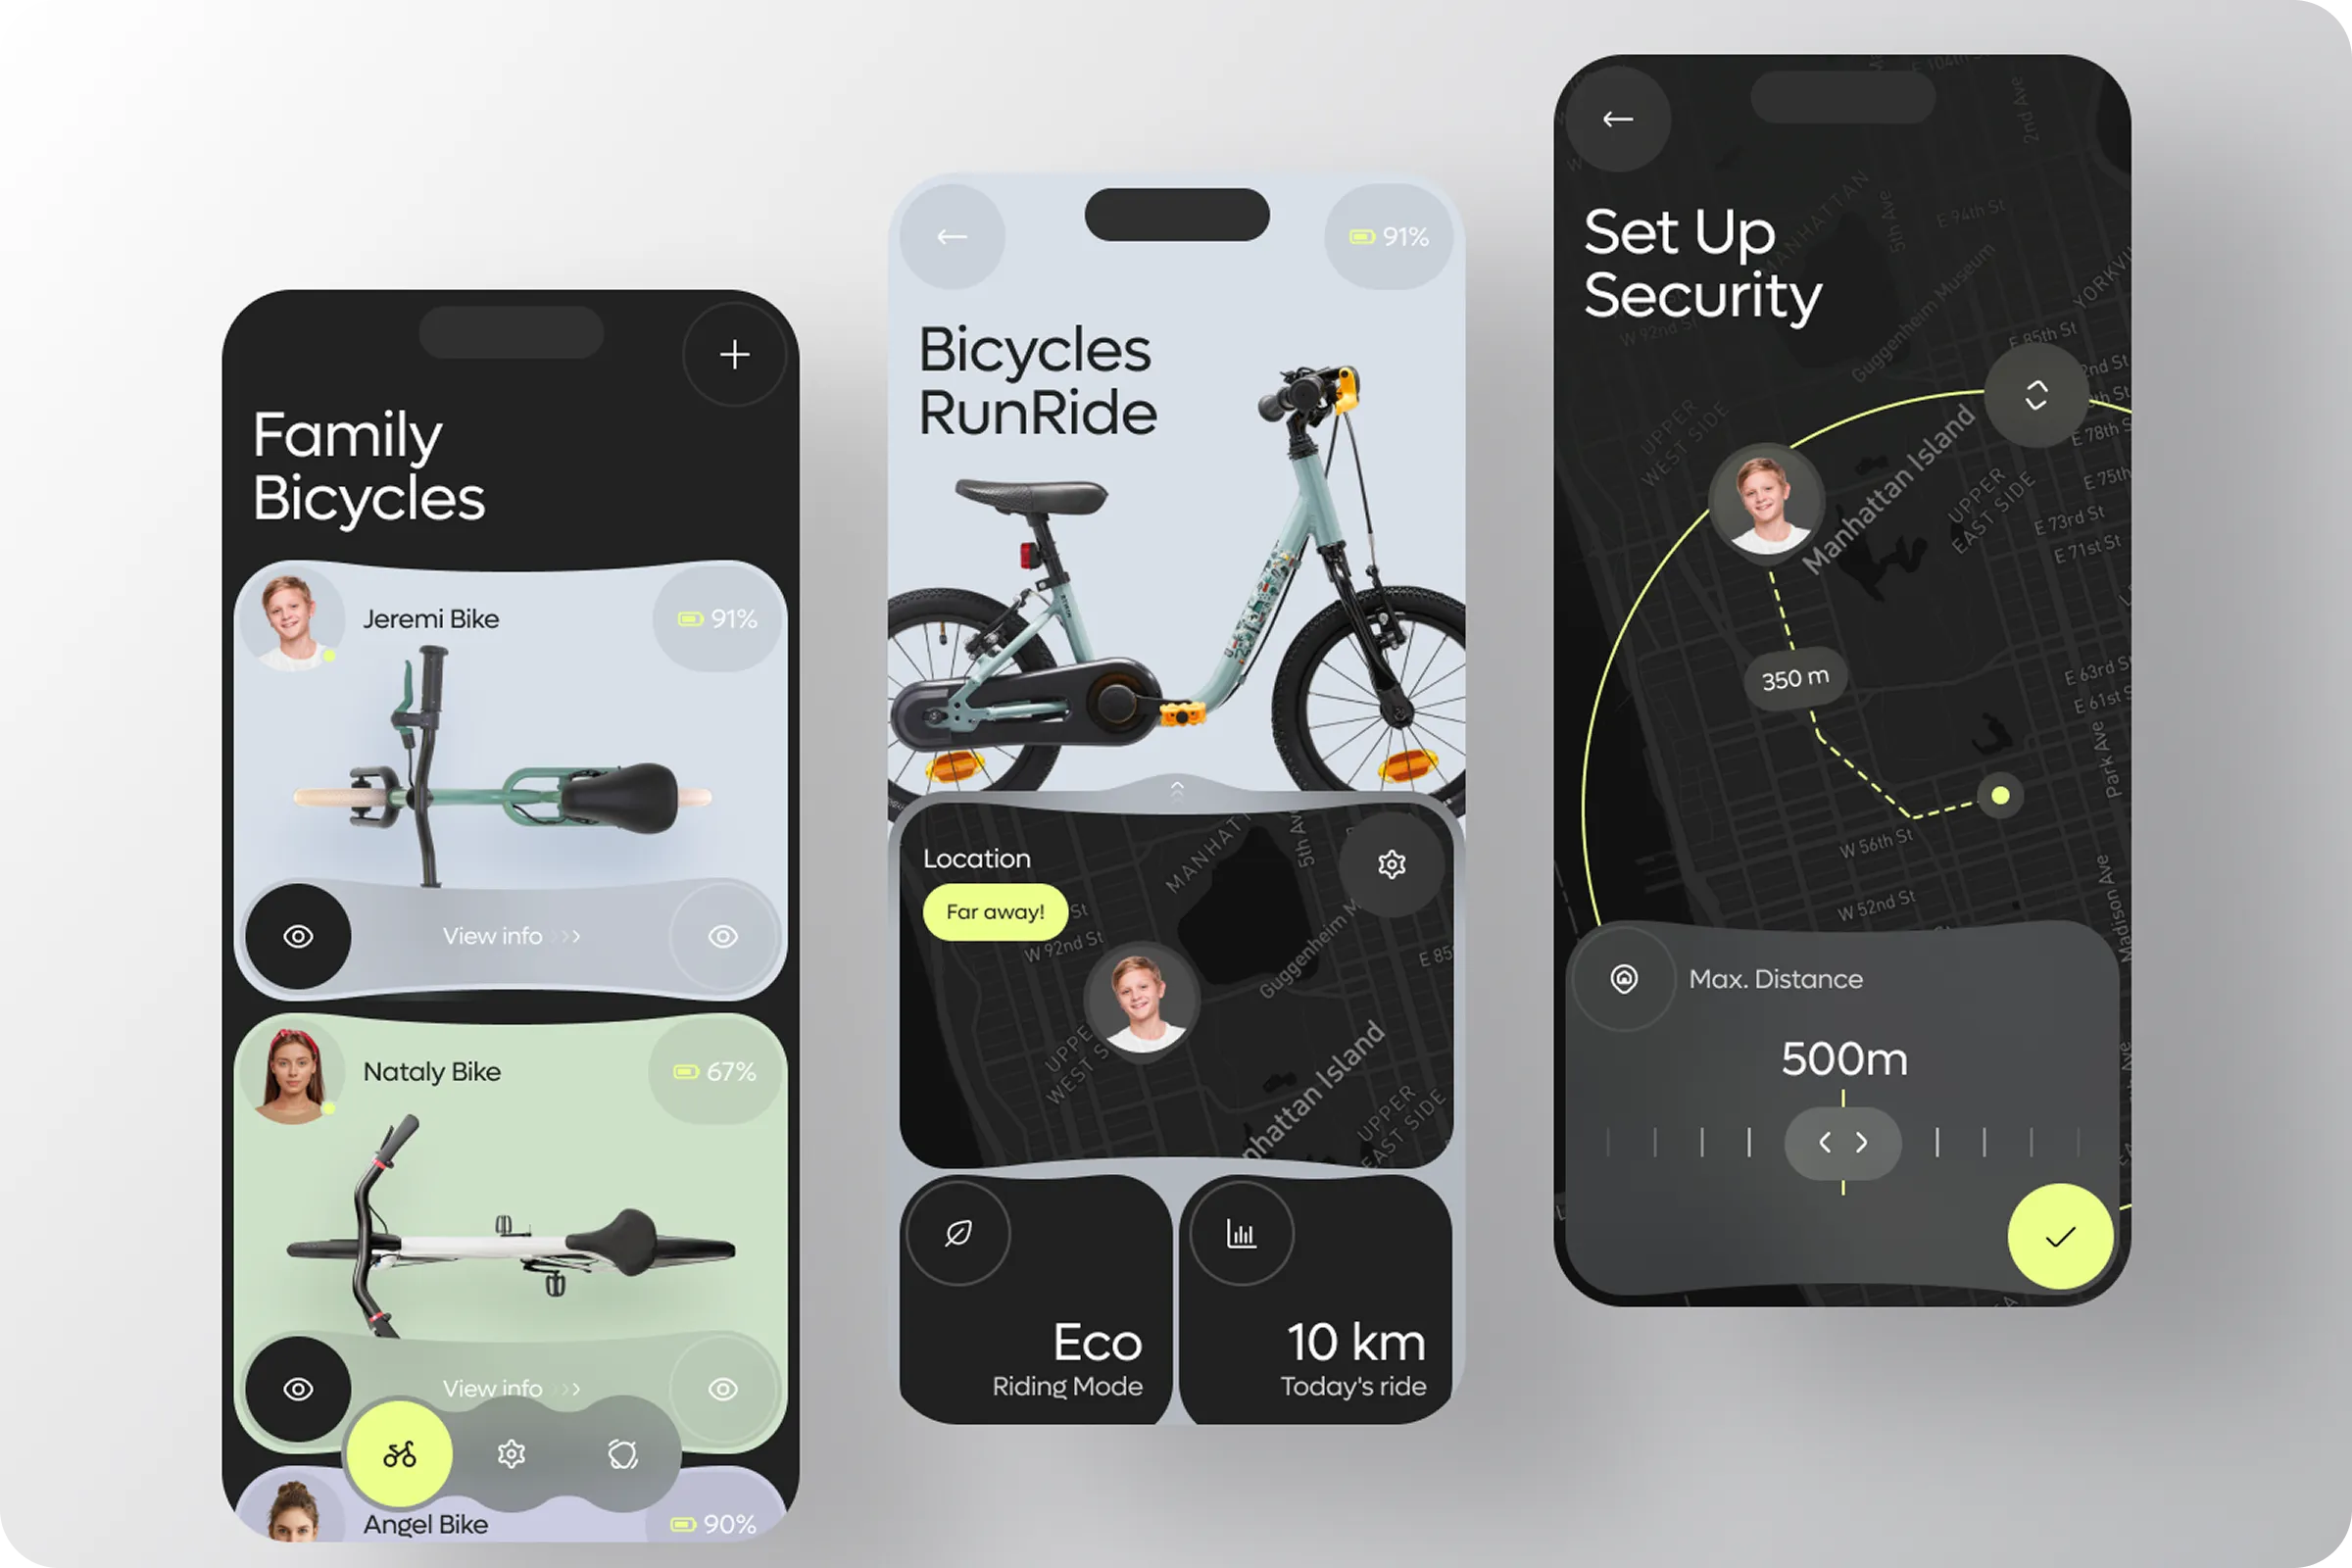
Mobile App
Improving Cycling Experience
The design focuses on optimizing user engagement through real-time location tracking, ride data visualization, and simple bike management tools. The interface is designed using principles of modern UX/UI design, prioritizing clarity, fast access, and intuitive navigation.
Top Feature Interactions
Real-Time Tracking
Track your bike’s location using GPS. Secure zones and alerts reduce uncertainty and improve perceived control.
Battery Monitoring
Visual charge indicators improve clarity and reduce drop-offs caused by uncharged bikes. Increases bike readiness and lowers customer support requests (CSR).
Statistics Dashboard
Users can view key ride data (distance, mode, daily usage) in one place. Supports tracking behavior over time to drive higher engagement.
Multi-Bike Management
All added bikes are accessible in one interface. Each bike’s status is visible with user-assigned profiles, improving usability for families.
Tab Navigation
Core functions (map, bike list, settings) are accessible through a simplified UI structure, reducing bounce rate and enhancing session depth.
Security Radius Setup
Users can define a maximum distance for their bikes. A simple control UI improves task completion and boosts trust in the app’s reliability.
AI Travel Industry | UX & UI Design AI For Travel Industry | UX & UI Design
Branding
Unified Identity for MyBike
We created a consistent brand system reflecting mobility and accessibility. The MyBike logo was applied to posters, event gear, and cycling merchandise to boost visibility and community presence.
Digital assets, including UI elements and social media templates, followed the same visual language. This improved recognition, increased user trust, and supported higher engagement and retention across both physical and online channels.
Product Design | UX & UI Design
Typography
Structure with Purpose
We used the Lufga typeface to support a clear and readable hierarchy across headings, subheadings, and body text. The choice was based on its balanced readability and alignment with the app’s focus on navigation and quick decision-making.
Our color system includes grey, yellow, light blue, light violet, and light green. These tones were selected to highlight key actions, separate interface sections, and reduce user friction. The combination of typography and color helps maintain a clean layout, supports visual priority, and improves overall interaction flow.
Product Design And Development | UX & UI Design
Landing page
Streamlined Access
The MyBike Mobile App example introduces a landing page built for quick access to real-time bike tracking, RunRide route planning, and a community Q&A section. Key features are grouped clearly, using minimal UI and responsive layout to support fast interaction.
This structure improves navigation flow, increases engagement with core tools, and helps reduce bounce rate by guiding users directly to high-value actions.
Artificial Intelligence In Travel Industry | UX & UI Design Product Design Services | UX & UI Design
Result
UX / UI Impact Summary
The project prioritized an intuitive interface to enhance ride tracking and navigation. Using feedback sessions and iterative design reviews, the team aligned user experience goals with performance improvements.
User Journey Results
75% - Stability index
Experienced reliable and consistent app performance throughout regular usage. Testing data showed minimal crashes, reduced UI lag, and stable screen transitions, contributing to higher retention and improved session duration.
Digital Product Design Services | UX & UI Design
Next cases


Shall we chat?
[email protected]Let’s

talk
Let’s
talk