


Explore the Wealthmentorgold UX/UI case study. We redesigned...
👀 1284 views
❤️ 103 likes
Too Long;
Didn't Read
46% faster navigation and 39% less time on reports. Here is what the NetSuite dashboard redesign changed:
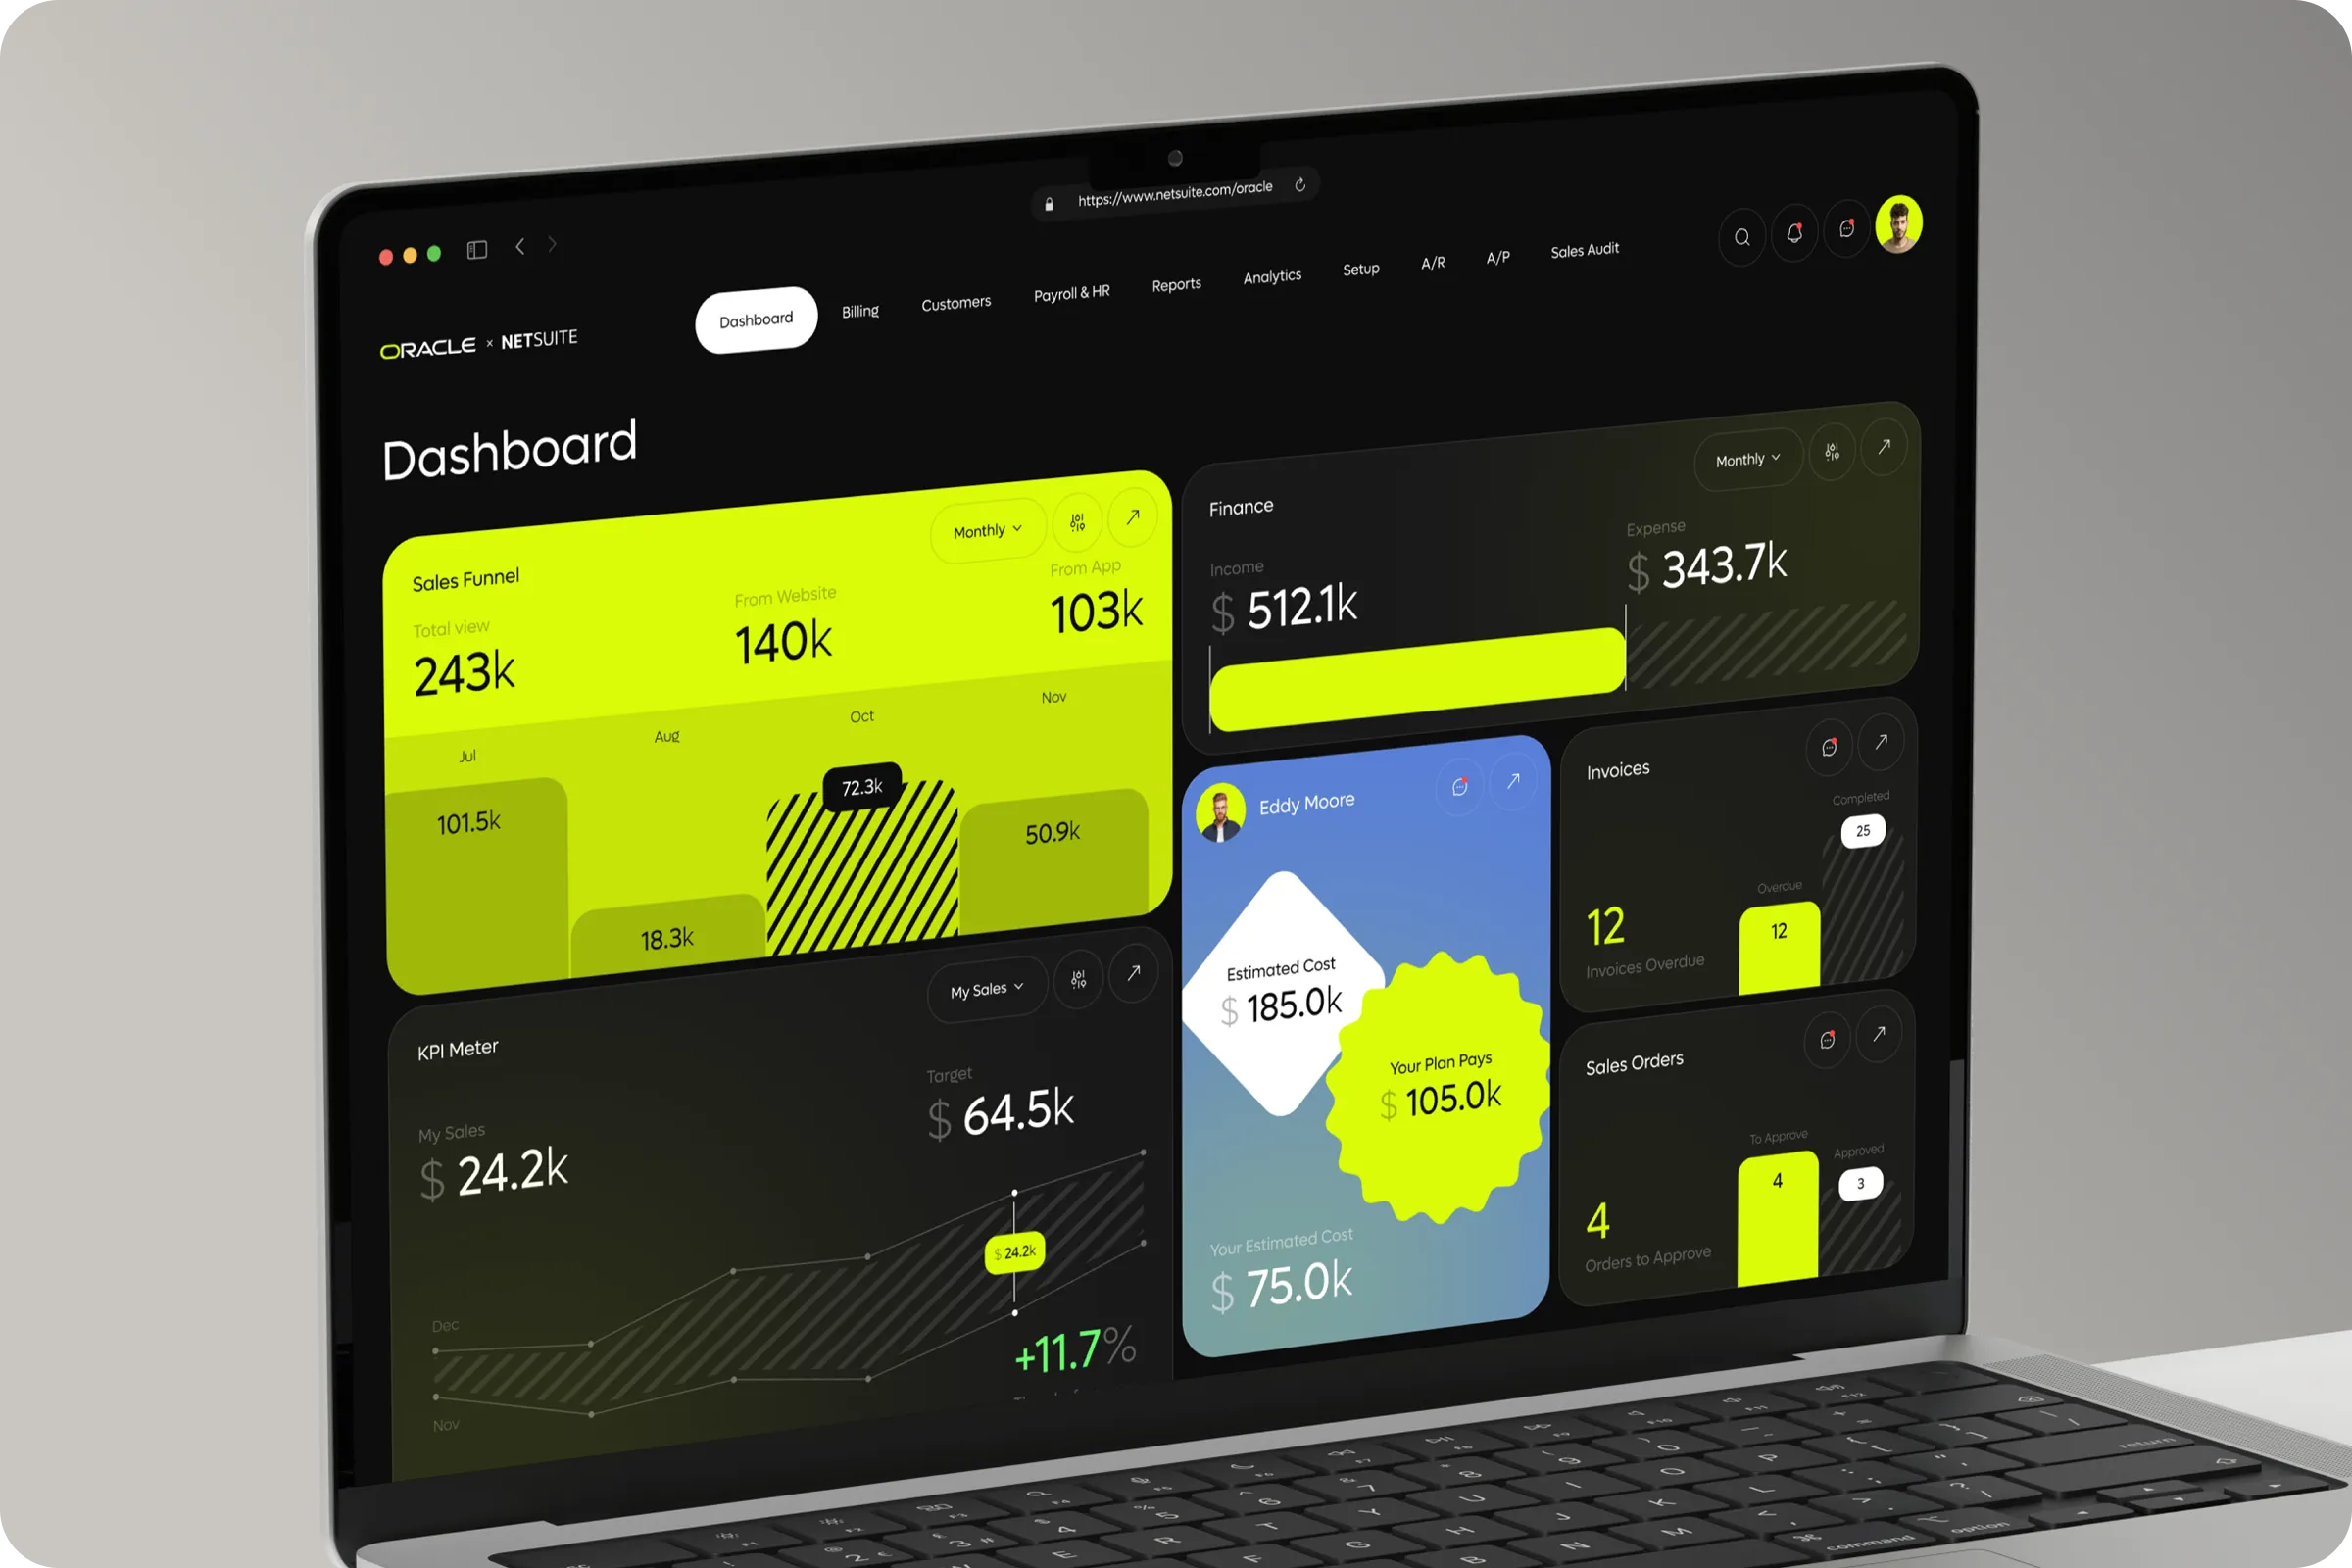
We are looking for a refreshed product dashboard design for Oracle NetSuite that simplifies workflow management, enhances real-time data visibility, and offers a user-friendly interface for teams across finance, sales, and operations.

Co-founder - Oracle

Oracle NetSuite is a cloud suite that runs finance, operations, and CRM for growing companies in one system. This project reimagined its dashboard, the screen every team opens first and returns to all day. The suite held the right data, but each module presented it differently. Finance read numbers one way, sales another, and operations a third. Moving between them meant relearning the layout each time. The brief asked for a cleaner experience, smoother data flow, and better accessibility for people who are not system experts. A controller, a sales manager, and an operations lead should all find their numbers in seconds and trust that those numbers match. We treated the dashboard as shared ground rather than a module of its own. Live data, consistent navigation, and adjustable widgets became the three rules every screen had to follow, on desktop and on mobile alike.
Industry
Finance, Business Management
Category
Web App
Location
Washington, D.C., USA

The interface asked too much of the people using it. Navigation shifted from module to module, and data sat scattered across finance, CRM, and operations views.
Non-technical staff felt it most. Tracking performance meant knowing where each number lived, and operational insight arrived late because assembling it took a specialist. The system was powerful, but only for the people who already knew it well.
Complicated Navigation
Every module followed its own logic. Decisions slowed, and teams leaned on outside support for tasks that should take a few clicks.
Fragmented Data Display
Finance and CRM reports lived in separate places. Tracking a KPI or building a report took several manual steps, and each step added room for error.

We started where the friction was highest. Our ux research combined surveys, usage data, and process mapping across departments to locate the operational bottlenecks. The result was a short list of measurable inefficiencies, each tied to a specific screen or step.
64% - Demand Unified Dashboard
Nearly two-thirds of operational managers needed one view of finance, CRM, and sales data. Manual reporting existed mainly because that view did not.
38% - Process Time Reduction Potential
Mapping each process step showed that simplifying core tasks could cut repetitive actions by 38% across departments.
47% - Prefer Mobile Data Access
Almost half of employees preferred mobile-friendly dashboards for checking KPIs and tasks between meetings.

We built a modular dashboard with adjustable widgets, faster navigation layers, and layouts that adapt between desktop and mobile. Each team arranges its own view, while navigation, colors, and data formats stay identical across modules. A sales manager and a controller see different widgets, but they read them the same way.
We worked on making the UI flexible, so teams can customize their dashboards based on their daily priorities.

CIO

The redesign sped up dashboard navigation by 46% and improved task completion across teams. Live data now sits one or two clicks away, reports are more accurate, and manual work has dropped. Moving three departments onto one shared, live view is a working digital transformation of daily operations. It also shows the standard the best customer relationship management software is judged on: the same numbers, in the same place, for every team.
+46% Faster Navigation
Reworked flows, optimized tabs, and fewer clicks to key metrics cut navigation time by 46%.
-39% Report Generation Time
Building tasks and reports took 39% less time after the redesign, which freed hours for analysis instead of assembly.

We’re excited to extend this work into adaptive mobile dashboards and custom reporting modules, helping our teams track KPIs on the go and delivering seamless user experiences across both desktop and mobile environments.
Co-founder − Oracle
Explore the Wealthmentorgold UX/UI case study. We redesigned...
👀 1284 views
❤️ 103 likes
Explore the XSignal UX/UI case study. We transformed...
👀 1532 views
❤️ 378 likes
The SailMatch - Yacht Personalized Searching Service Onboarding...
👀 3176 views
❤️ 343 likes
Organize athlete training, match data, and performance tracking....
👀 3173 views
❤️ 320 likes
Shall we chat?
[email protected]Let’s

talk


